P2 Tool Quick Start Guide

Introduction
The TRI Pollution Prevention (P2) Search Tool offers easy access to the P2 information submitted by industrial facilities in their Toxics Release Inventory (TRI) reports. This guide demonstrates how you can use the P2 Search Tool to help answer your questions about P2, waste management, and environmental progress at facilities. Click on the four main questions below to learn about the primary functions of the Tool or click on a bulleted sub-topic to jump to a specific feature. Click on any item highlighted with a blue box for more details.
Questions covered in this Guide include:
- What P2 information is reported to TRI and where can I find definitions of P2 terminology?
- How do I find reported P2 practices for a specific chemical and/or industry?
-
How do I compare P2 progress and waste management
practices across facilities?
- How can I view waste management trends for a whole industry?
- How can I tell whether facilities have made progress at reducing toxic chemical waste?
- Can I see facilities' greenhouse gas (GHG) emissions alongside their TRI information?
- Can I download my results to Excel (including data that do not fit in the charts)?
- How do I see which facilities managed the greatest quantities of a chemical?
-
How do I view the P2 efforts reported by a specific
facility?
- Can I see waste management of a specific chemical at a facility over time?
- How do I know whether waste management trends are driven by changes in production?
- How can I tell whether a facility's waste management practices are similar to the rest of its industry?
- Can I download all P2 information reported by a specific facility?
- Can I see a facility's greenhouse gas (GHG) emissions trend alongside its TRI trends?
1. P2 information reported to TRI and P2 terminology
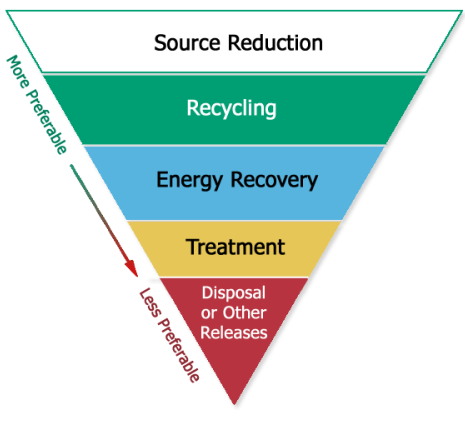
TRI tracks each facility's progress towards the goals of the Pollution Prevention Act using the framework provided by the waste management hierarchy (see below). The Pollution Prevention Overview provides a full explanation of the information collected and meaning of key P2-related terms.
2. Find P2 examples for a specific chemical and industry
Start at the main P2 search page: https://enviro.epa.gov/facts/tri/p2.html. Select Search Criteria and then click "Show P2 Activities."
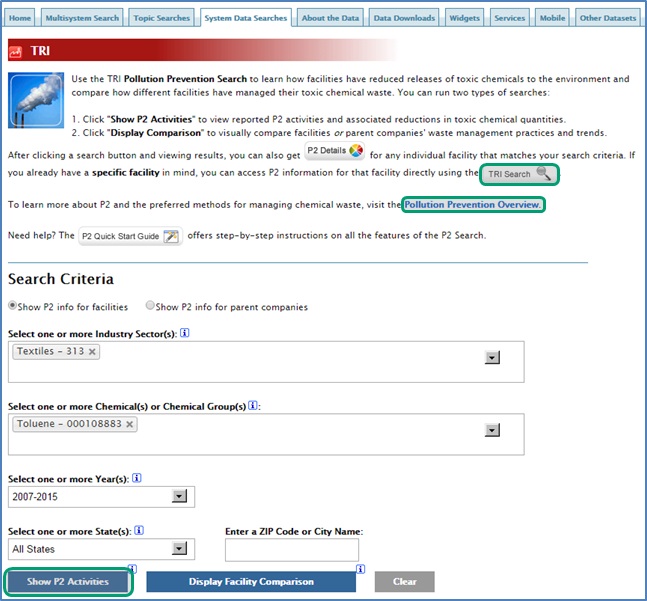
The TRI Search allows users to search for TRI information by facility, address, industry, or chemical.
Overview of Search Results Page
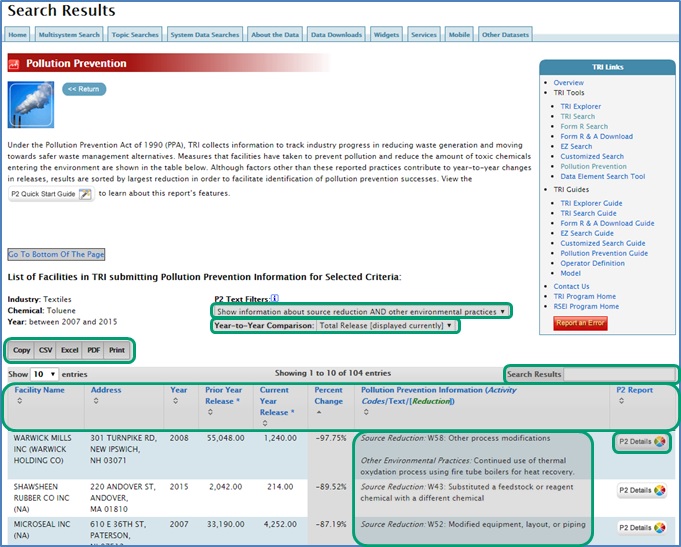
Your P2 search results will be displayed in the default format, where facilities with the greatest reduction in releases are listed first. There are several ways to limit and sort search results. Click on the blue outlined boxes to see how.
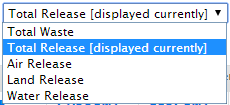
Use the "Value for Year-to-Year Comparison"
dropdown to change the waste type shown in the results
table. You can display chemical- and facility- specific
reported total waste (includes quantities released,
recycled, used for energy recovery, or treated), total
releases (to air, water, land, and off-site releases),
air releases, land releases, or water releases.
For example, you can sort your search
results to show P2 text for facilities with the greatest
decrease in on-site air releases.
Use the Search bar to find P2 entries related to a specific keyword. (Tip: use spellings that capture multiple forms of search terms.)
For example, you can search for “substitut” to find source reduction activities where alternative chemicals were substituted for a selected chemical. Or type in “W5” if you're interested in process modifications (source reduction codes W50-W58).
The P2 Details button will open the P2 Details page with detailed information on P2 activities and waste management practices for that specific facility and chemical. This information can help you understand how releases changed in the years after P2 activities were implemented.
3. Compare P2 progress and waste management practices across facilities
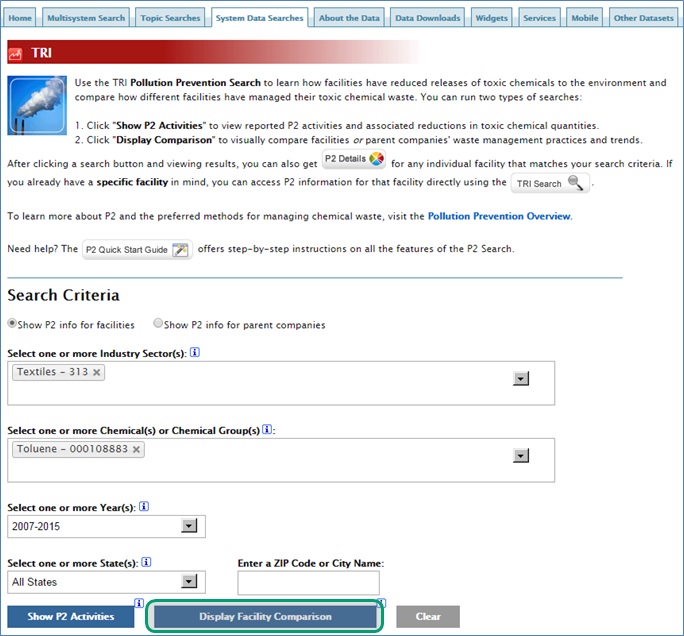
Start at the main P2 search page: https://enviro.epa.gov/facts/tri/p2.html. Select Search Criteria and then click "Display Facility Comparison Report."
Overview of Facility Comparison Report Page
Your facility comparison results will be displayed in the default format, with waste quantities displayed for the top 30 facilities. There are several ways to modify the display and view additional metrics. Click on the blue outlined boxes to see how.
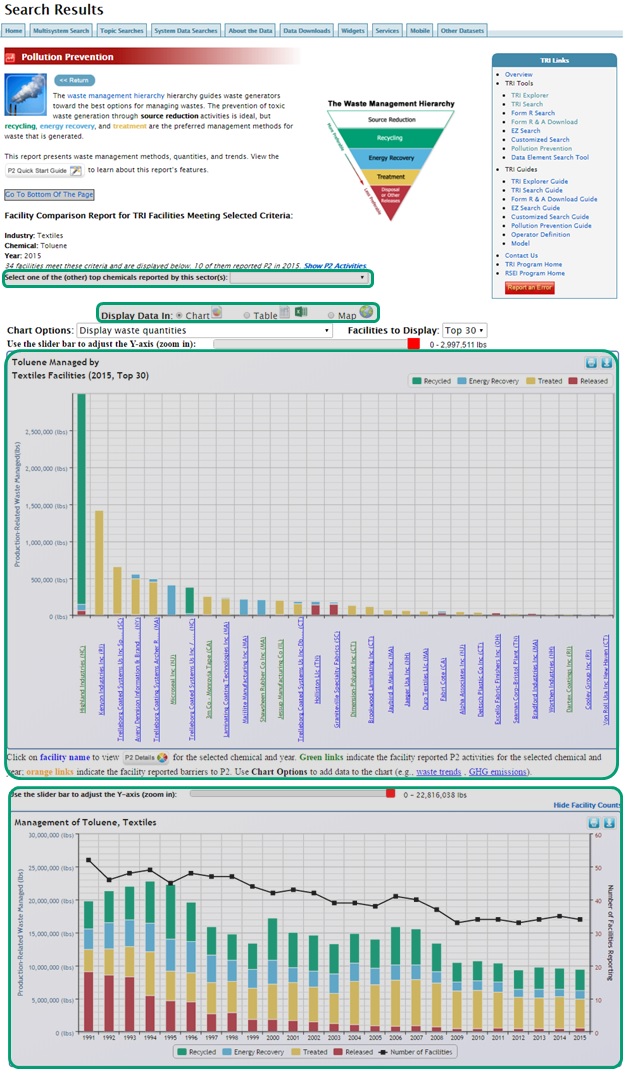
The facility comparison chart compares TRI production-related waste management by facility for the selected industry and chemical (in this example, toluene waste in textile manufacturing). It also can display a five-year trend for TRI waste managed or greenhouse-gas releases; see the Facility Comparison Chart for more details. Note that production-related waste is reported and displayed for all TRI facilities, not just facilities that implemented P2 activities.
The Facility Comparison Chart
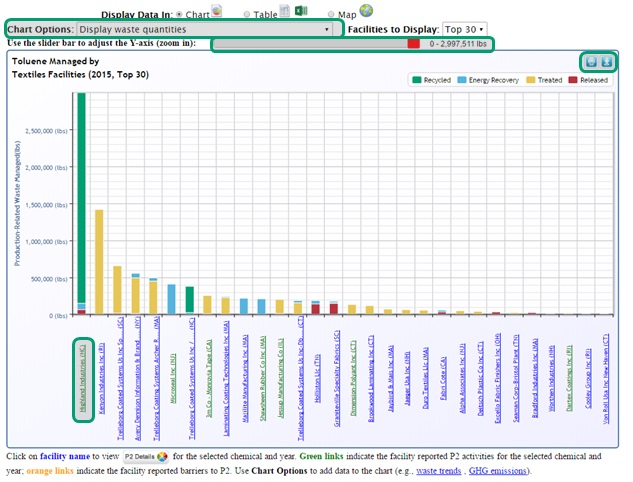
In addition to TRI production-related waste, this option displays the greenhouse gas emissions (in metric tons CO2- equivalent) for all facilities that report to both TRI and EPA's Greenhouse Gas Reporting Program (GHGRP). Note that some sectors (e.g., textiles) do not have many facilities that are required to report to both TRI and GHGRP.
Click on a facility name to view P2 Details for the selected facility, chemical and year. Green links indicate that the facility has reported P2 information for the selected chemical and year, orange links indicate the facility reported barriers to P2, and blue links indicate that the facility has not reported any P2 information for the selected chemical and year. The P2 Details page has detailed information on P2 activities and waste management practices for that specific facility and chemical.
4. Learn about the waste management practices and pollution prevention efforts of a specific chemical at a specific facility
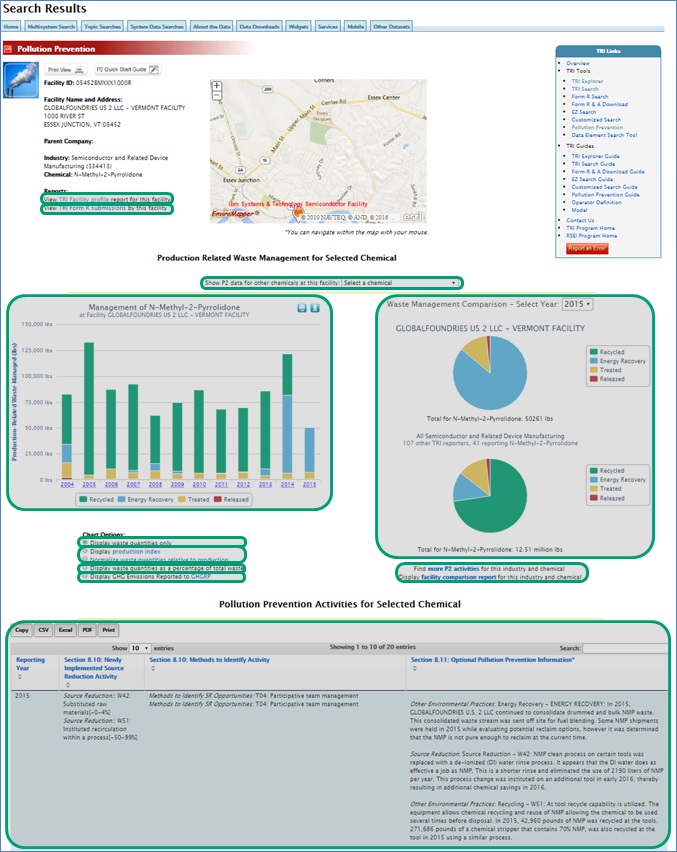
The “P2 Details” page contains detailed information about waste management quantities and practices at a specific facility. There are several ways to find the P2 Details Page, as illustrated by the examples above. You can also find P2 Details for a specific chemical/facility by using the basic TRI Search in Envirofacts.
Start at the main TRI Search page in Envirofacts: https://www.epa.gov/enviro/tri-search. Select Search Criteria and click "Search."
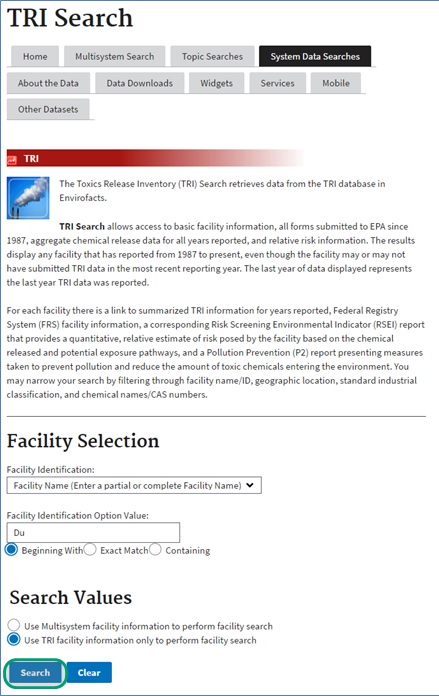
The Search Results page shows a list of facilities that meet your search criteria. Select “Report” under P2 Report for the facility you are interested in to navigate to the facility's P2 Report.
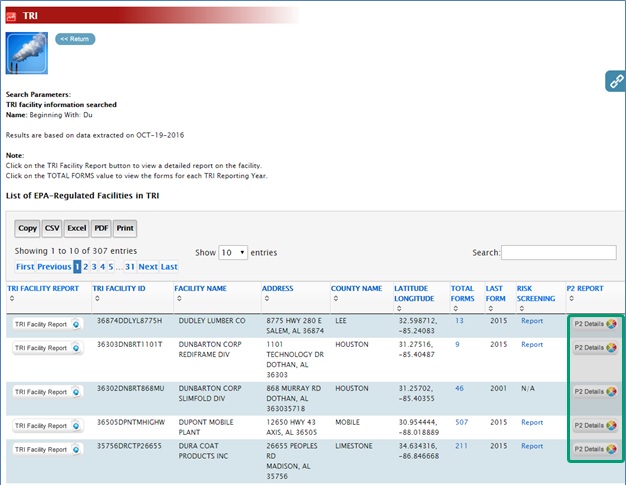
The table at the bottom of the facility's P2 Report shows the years in which the specific facility reported P2 information (TRI Section 8.10 and 8.11) for each chemical. On the Pollution Prevention Activities table, select "P2 Details" for the specific chemical of interest.
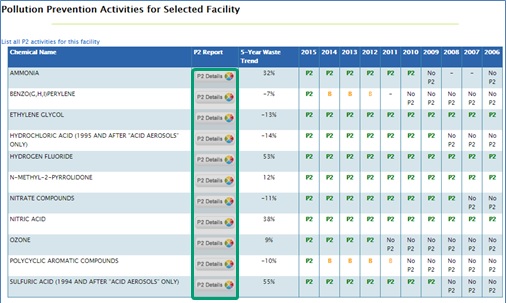
Overview of P2 Details Page
Waste management and pollution prevention details are provided for the selected chemical and facility in the format below. Click on the blue outlined boxes to learn more about this report.
Additional Resources
-
TRI Pollution Prevention website
- Learn more about the types of Pollution Prevention Information collected by TRI.
-
TRI Pollution Prevention Reporting Tip Sheet
- Learn about how to highlight your Pollution Prevention information when reporting to TRI.
-
Pollution Prevention in the National Analysis
- See the various ways the National Analysis is highlighting P2 information.